1. Dry Porosity is measured on Rocks without any water or fluid in their pores
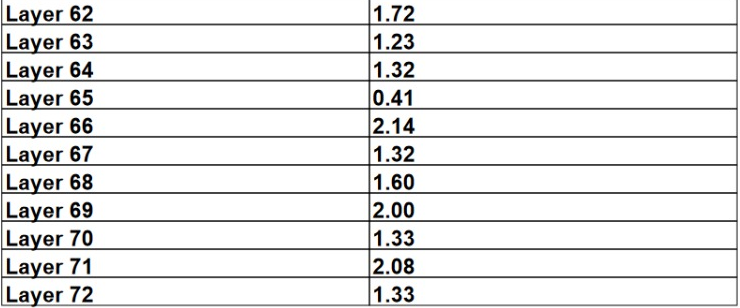
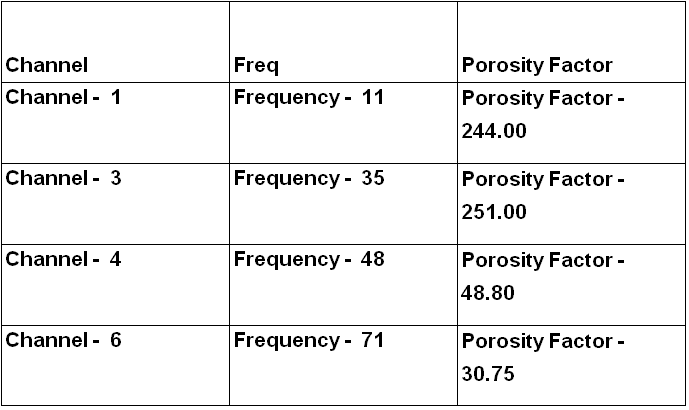
2. Wet Porosity is measured on saturated coresPorosity Factor = Tx / Rx
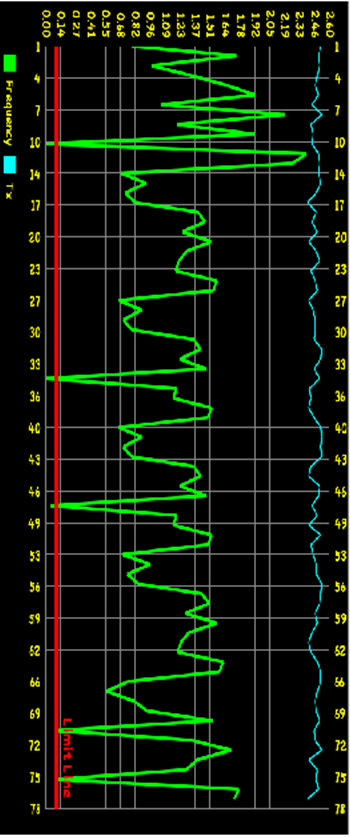
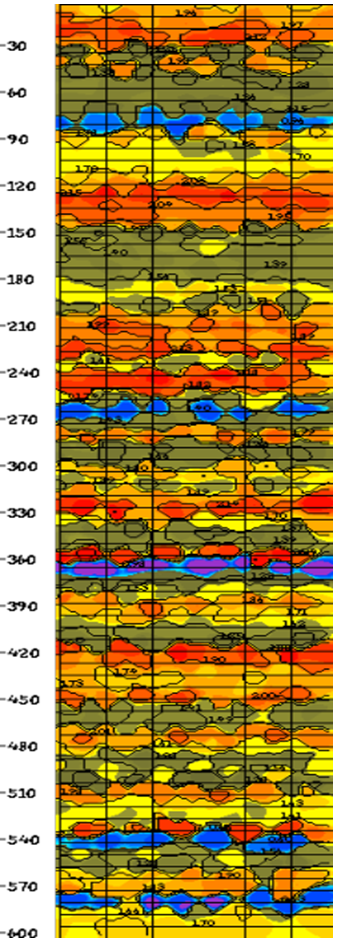
Note- Reports generated are based on frequencies transmitted, frequencies received and differences in frequency levels at each stage, and the geological fault should be monitored as per borehole data, geomorphology, and hydrogeological conditions of a particular site selection. Finlay Instruments calibrations are up to the mark and can be suitable for favorable geological conditions cent percent results cannot be assured in groundwater surveys as per geological changes and frequency differences based on the earth's temperature, magnetic field, and gravity differences.


